> ## Documentation Index
> Fetch the complete documentation index at: https://docs.bubblav.com/llms.txt
> Use this file to discover all available pages before exploring further.
# Reports Overview
> Track your chatbot performance and usage
Understand how your chatbot is performing, what customers are asking, and how your team responds. Make data-driven decisions to improve customer experience.
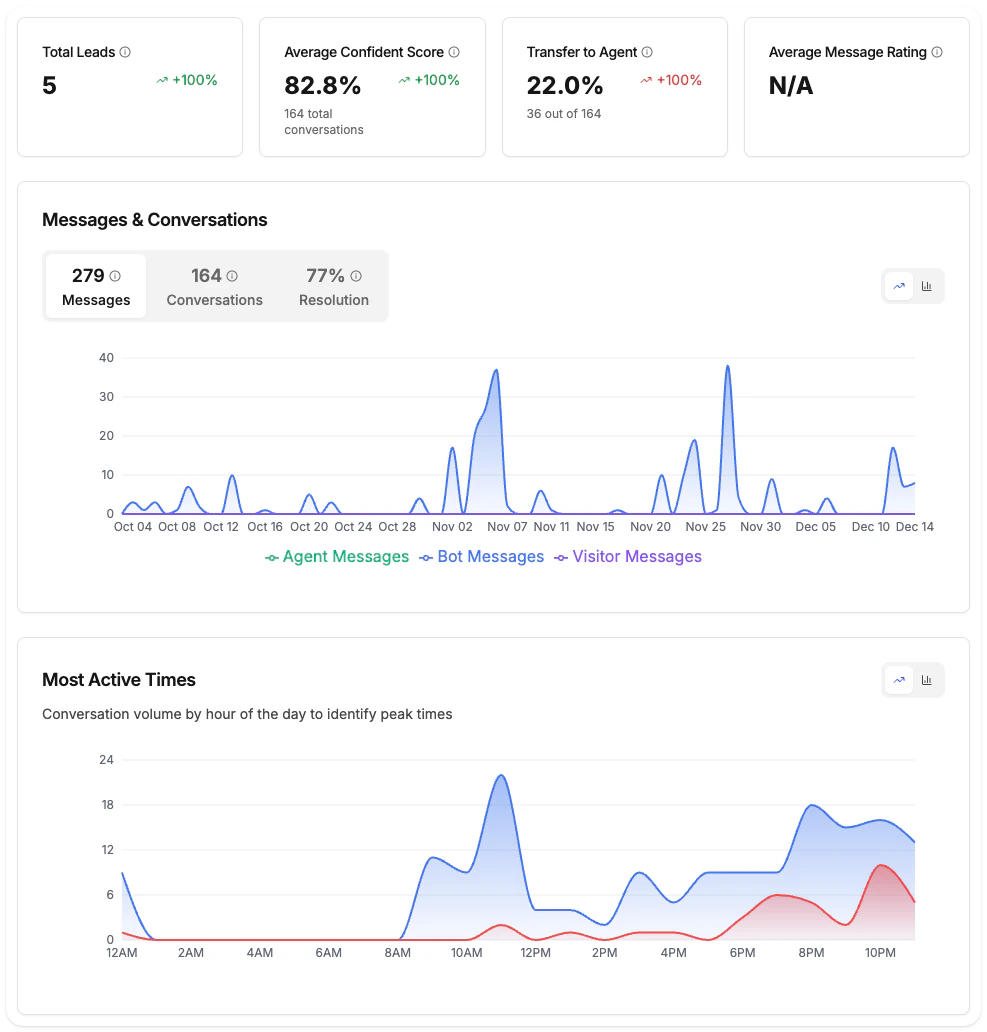
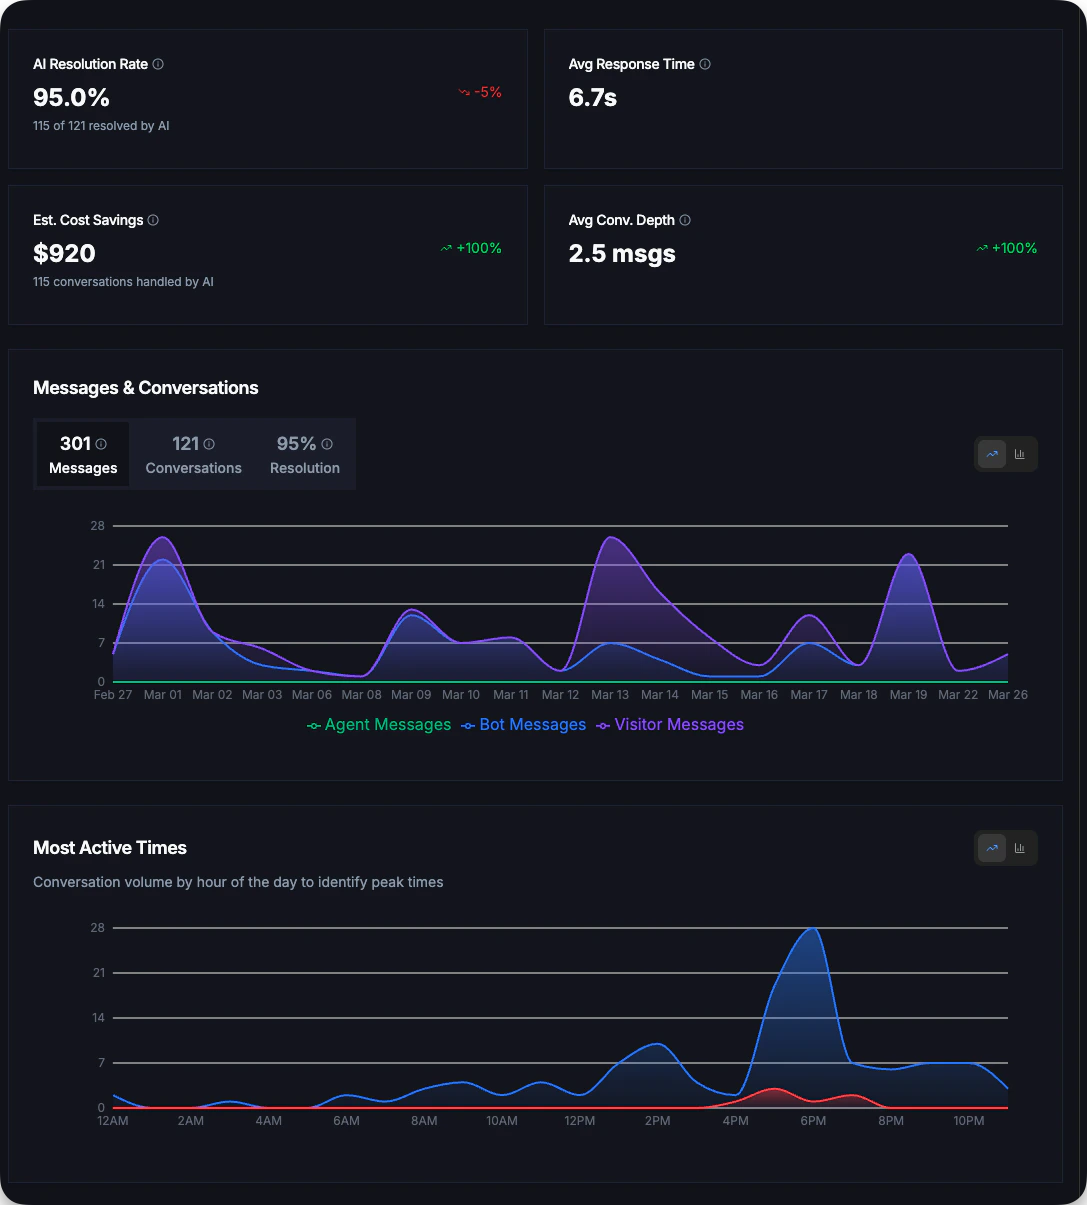 ## Accessing Reports
Go to [bubblav.com/dashboard](https://www.bubblav.com/dashboard)
Click on the website you want to analyze
Click **Reports** in the sidebar menu
***
## Report Categories
BubblaV Reports are organized into two tiers based on your subscription plan.
Essential metrics available to all users including AI Resolution Rate, Response Time, Leads, and Message Rating.
Advanced analytics for Pro plans including Cost Savings, Confidence Scores, Geographic insights, and AI performance analysis.
***
## Time Range Selection
Filter reports by date range:
| Range | Best For |
| ---------------- | ----------------------------- |
| **Today** | Real-time monitoring |
| **Last 7 days** | Weekly trends |
| **Last 30 days** | Monthly performance review |
| **Custom range** | Specific campaigns or periods |
Click the date picker in the top-right corner to change the range.
***
## Data Updates
Reports data is updated daily at 2 PM UTC (14:00). Real-time data may have slight delays of up to 24 hours.
***
## Exporting Reports
Download your data for offline analysis.
### Export Full Report
Export all report data as CSV:
Choose the time period you want to export
Click the **Export Report** button in the top-right corner
The file will download automatically with all analytics data
The export includes:
* All conversation data
* Message details
* Lead information
* Analytics metrics
* Timestamps and metadata
***
## Plan Comparison
| Feature | Free | Pro |
| ---------------------------------- | ---- | --- |
| **AI Resolution Rate** | Yes | Yes |
| **Avg Response Time** | Yes | Yes |
| **Total Leads** | Yes | Yes |
| **Message Rating** | Yes | Yes |
| **Messages & Conversations Trend** | Yes | Yes |
| **Est. Cost Savings** | - | Yes |
| **Average Confidence** | - | Yes |
| **Transfer to Agent** | - | Yes |
| **Avg Conversation Depth** | - | Yes |
| **Most Active Times** | - | Yes |
| **Conversation Flow** | - | Yes |
| **Visitor Geography** | - | Yes |
| **Conversation Geography** | - | Yes |
| **Top Unanswered Questions** | - | Yes |
| **Bad Feedback Conversations** | - | Yes |
| **Most Visited Links** | - | Yes |
| **Leads List** | - | Yes |
| **Export Reports** | Yes | Yes |
***
## Best Practices
Set aside time each week to review reports. Look for trends, not just individual days.
The "Top Unanswered Questions" report is your roadmap for knowledge base improvements.
Schedule live support coverage during your busiest hours using the Most Active Times chart.
Compare month-over-month to see improvement trends. Use the comparison indicators on each metric.
Export and share reports with stakeholders to show chatbot value and ROI.
***
## Troubleshooting
* Select a date range that has data
* Wait 24 hours for new conversations to appear
* Refresh the page
* Check the selected date range
* Verify timezone settings
* Note: Real-time data may have slight delays
* Try a smaller date range
* Check browser popup blockers
* Use a different browser
***
## Next Steps
View metrics available on all plans
Explore advanced analytics features
## Accessing Reports
Go to [bubblav.com/dashboard](https://www.bubblav.com/dashboard)
Click on the website you want to analyze
Click **Reports** in the sidebar menu
***
## Report Categories
BubblaV Reports are organized into two tiers based on your subscription plan.
Essential metrics available to all users including AI Resolution Rate, Response Time, Leads, and Message Rating.
Advanced analytics for Pro plans including Cost Savings, Confidence Scores, Geographic insights, and AI performance analysis.
***
## Time Range Selection
Filter reports by date range:
| Range | Best For |
| ---------------- | ----------------------------- |
| **Today** | Real-time monitoring |
| **Last 7 days** | Weekly trends |
| **Last 30 days** | Monthly performance review |
| **Custom range** | Specific campaigns or periods |
Click the date picker in the top-right corner to change the range.
***
## Data Updates
Reports data is updated daily at 2 PM UTC (14:00). Real-time data may have slight delays of up to 24 hours.
***
## Exporting Reports
Download your data for offline analysis.
### Export Full Report
Export all report data as CSV:
Choose the time period you want to export
Click the **Export Report** button in the top-right corner
The file will download automatically with all analytics data
The export includes:
* All conversation data
* Message details
* Lead information
* Analytics metrics
* Timestamps and metadata
***
## Plan Comparison
| Feature | Free | Pro |
| ---------------------------------- | ---- | --- |
| **AI Resolution Rate** | Yes | Yes |
| **Avg Response Time** | Yes | Yes |
| **Total Leads** | Yes | Yes |
| **Message Rating** | Yes | Yes |
| **Messages & Conversations Trend** | Yes | Yes |
| **Est. Cost Savings** | - | Yes |
| **Average Confidence** | - | Yes |
| **Transfer to Agent** | - | Yes |
| **Avg Conversation Depth** | - | Yes |
| **Most Active Times** | - | Yes |
| **Conversation Flow** | - | Yes |
| **Visitor Geography** | - | Yes |
| **Conversation Geography** | - | Yes |
| **Top Unanswered Questions** | - | Yes |
| **Bad Feedback Conversations** | - | Yes |
| **Most Visited Links** | - | Yes |
| **Leads List** | - | Yes |
| **Export Reports** | Yes | Yes |
***
## Best Practices
Set aside time each week to review reports. Look for trends, not just individual days.
The "Top Unanswered Questions" report is your roadmap for knowledge base improvements.
Schedule live support coverage during your busiest hours using the Most Active Times chart.
Compare month-over-month to see improvement trends. Use the comparison indicators on each metric.
Export and share reports with stakeholders to show chatbot value and ROI.
***
## Troubleshooting
* Select a date range that has data
* Wait 24 hours for new conversations to appear
* Refresh the page
* Check the selected date range
* Verify timezone settings
* Note: Real-time data may have slight delays
* Try a smaller date range
* Check browser popup blockers
* Use a different browser
***
## Next Steps
View metrics available on all plans
Explore advanced analytics features