> ## Documentation Index
> Fetch the complete documentation index at: https://docs.bubblav.com/llms.txt
> Use this file to discover all available pages before exploring further.
# Pro+ Reports
> Advanced analytics for Pro plans
These reports are available exclusively on **Pro** plans. [Upgrade your plan](https://www.bubblav.com/dashboard/subscription) to access these features.
Pro+ reports provide deeper insights into your chatbot's performance, ROI, and areas for improvement.
***
## Advanced Analytics Dashboard
In addition to the [Free metrics](/user-guide/reports/free), Pro+ users get four additional dashboard cards.
### Pro+ Metrics
Estimated cost savings from AI handling conversations instead of human agents.
**Calculation:** Conversations resolved by AI × \$8 (industry average cost per agent-handled conversation)
Use this to demonstrate ROI to stakeholders.
Average confidence score of AI responses (0-100%).
**Higher scores** indicate the AI was more certain about its answers. Low confidence often means the knowledge base needs more content on that topic.
Percentage of conversations escalated to live support agents.
**Lower is better** - indicates your AI is handling more queries independently. This is the inverse of AI Resolution Rate.
Average number of messages exchanged per conversation.
Shows how engaged visitors are with your chatbot. Very short conversations might indicate quick resolutions or early abandonment.
### Understanding the Numbers
| Metric | Good | Needs Attention |
| ---------------------- | -------- | --------------- |
| **Transfer to Agent** | \< 20% | > 40% |
| **Average Confidence** | > 70% | \< 50% |
| **Avg Conv. Depth** | 3-8 msgs | \< 2 or > 15 |
A very high conversation depth (>15 messages) might indicate visitors are struggling to get answers. Review these conversations to identify issues.
***
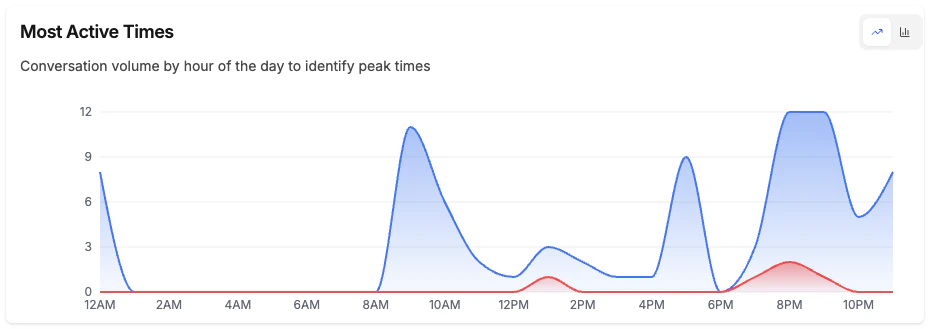
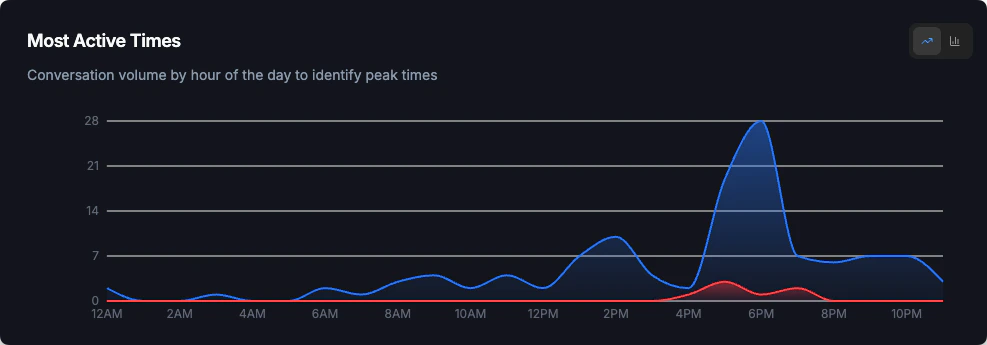
## Most Active Times
Visualize conversation volume by hour of the day to optimize your support coverage.
 ### Chart Options
* **Bar chart**: Clear visualization of peak hours
* **Line chart**: See trends throughout the day
### Use This To
1. **Schedule live support**: Ensure agents are available during peak hours
2. **Plan content updates**: Deploy changes during low-traffic periods
3. **Optimize global coverage**: If you see activity across many hours, consider coverage for different time zones
Times are displayed in UTC. Factor in your timezone when planning support schedules.
***
## Conversation Flow
Visual Sankey diagram showing how conversations are handled through your system.
### Chart Options
* **Bar chart**: Clear visualization of peak hours
* **Line chart**: See trends throughout the day
### Use This To
1. **Schedule live support**: Ensure agents are available during peak hours
2. **Plan content updates**: Deploy changes during low-traffic periods
3. **Optimize global coverage**: If you see activity across many hours, consider coverage for different time zones
Times are displayed in UTC. Factor in your timezone when planning support schedules.
***
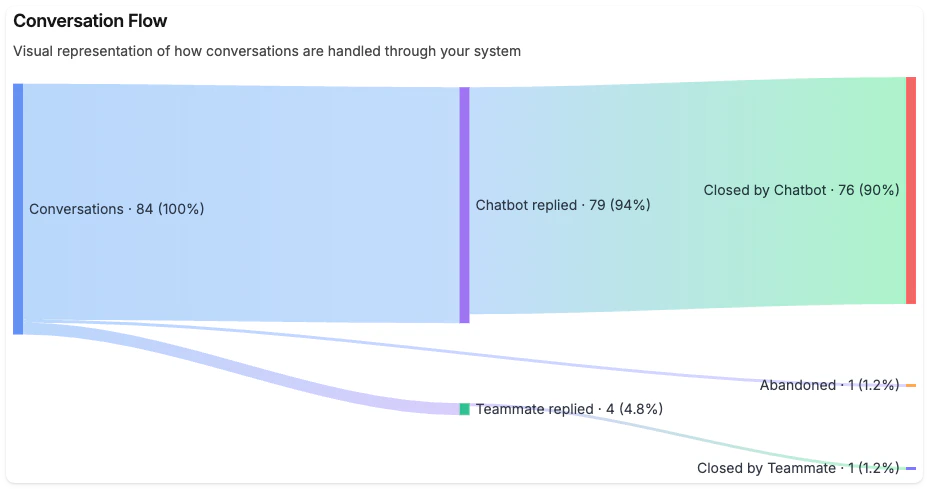
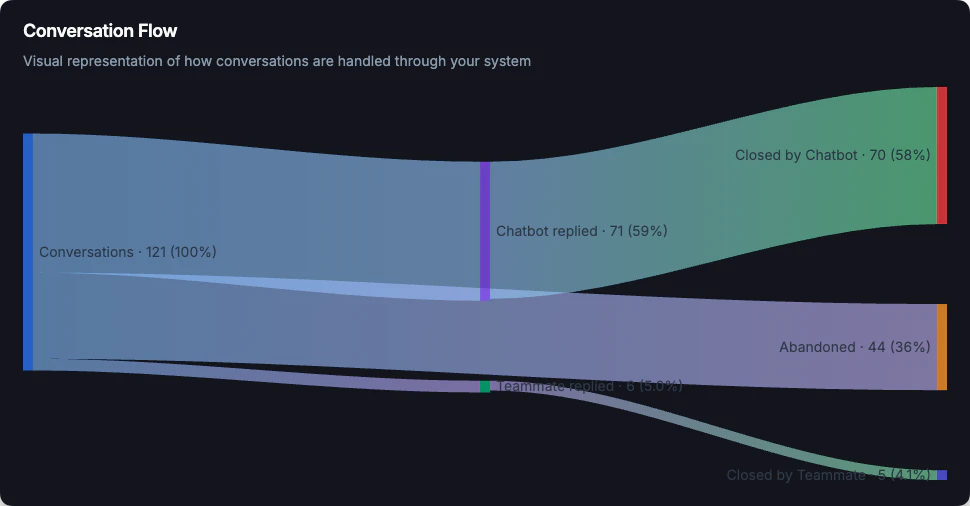
## Conversation Flow
Visual Sankey diagram showing how conversations are handled through your system.
 ### Flow Paths
The diagram shows:
| Stage | Description |
| ---------------------- | ---------------------------------------------------- |
| **Initial Reply** | Who responded first - Chatbot, Teammate, or No reply |
| **Chatbot Replied** | Conversations where AI responded |
| **Teammate Replied** | Conversations escalated to human agents |
| **Closed by Chatbot** | Resolved by AI alone |
| **Closed by Teammate** | Resolved by human agent |
| **Abandoned** | Visitor left without resolution |
### What to Look For
* **High "No Reply" rate**: Check if your chatbot is responding correctly
* **High "Abandoned" rate**: Visitors may not be finding helpful answers
* **High "Teammate Replied" rate**: AI may need more training content
***
## Geography
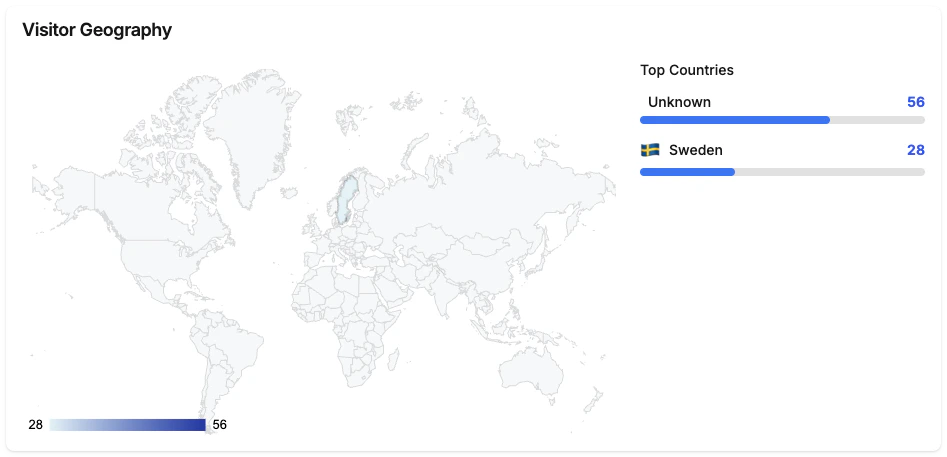
See where your audience comes from with two interactive world maps, shown side by side.
### Flow Paths
The diagram shows:
| Stage | Description |
| ---------------------- | ---------------------------------------------------- |
| **Initial Reply** | Who responded first - Chatbot, Teammate, or No reply |
| **Chatbot Replied** | Conversations where AI responded |
| **Teammate Replied** | Conversations escalated to human agents |
| **Closed by Chatbot** | Resolved by AI alone |
| **Closed by Teammate** | Resolved by human agent |
| **Abandoned** | Visitor left without resolution |
### What to Look For
* **High "No Reply" rate**: Check if your chatbot is responding correctly
* **High "Abandoned" rate**: Visitors may not be finding helpful answers
* **High "Teammate Replied" rate**: AI may need more training content
***
## Geography
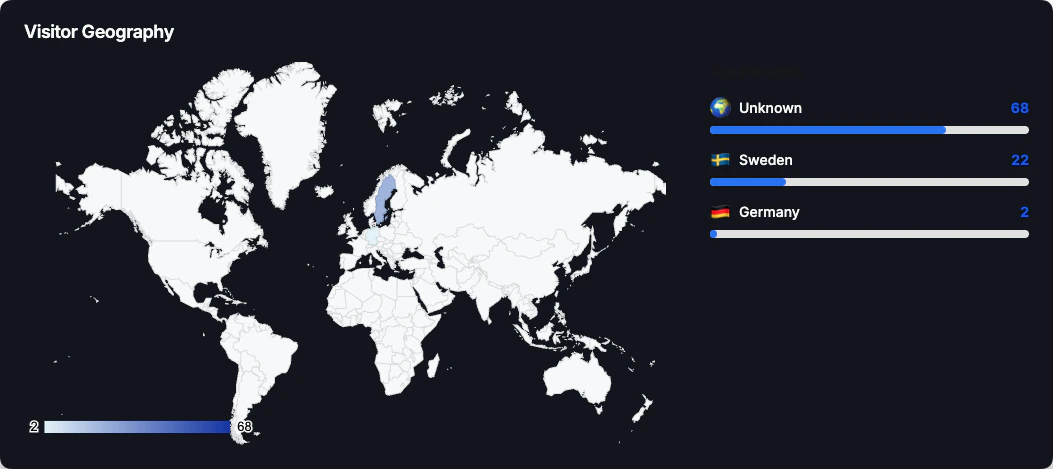
See where your audience comes from with two interactive world maps, shown side by side.
 ### Two views
* **Visitor Geography**: Where all of your visitors come from. Counts every visitor who loaded the widget (by their first visit), so it reflects overall reach and traffic sources.
* **Conversation Geography**: Where your engaged visitors come from. Counts only visitors who started a conversation, so you can see which regions actually interact with your chatbot.
### Features
* **World map visualization**: Color-coded by volume (visitors or conversations)
* **Top 10 countries**: List with counts and flags for each view
### Use This To
* **Understand your global audience**: See if you're reaching target markets
* **Plan multilingual support**: High traffic from non-English countries may need translated content
* **Optimize support hours**: Schedule agents for time zones with most traffic
* **Tailor content**: Create region-specific answers for common questions
* **Compare reach vs. engagement**: A country with many visitors but few conversations may signal a language or relevance gap worth addressing
***
## Top Unanswered Questions
See specific questions that the AI failed to answer or answered with low confidence.
### What's Shown
| Column | Description |
| ------------- | -------------------------------------- |
| **Question** | The exact question asked by visitors |
| **Frequency** | How many times this question was asked |
| **Reason** | Low confidence or bad rating |
| **Last Seen** | When this question was last asked |
### Actions
For each unanswered question, you can take action:
| Action | Description |
| ------------ | ------------------------------------------------------ |
| **Add Q\&A** | Create a manual Q\&A entry directly from this question |
| **Dismiss** | Hide questions you've already addressed |
The Q\&A dialog opens with the question pre-filled
Provide a clear, helpful response
The question is removed from your list and added to your knowledge base
Review this report weekly. Each question you address improves your AI Resolution Rate and reduces agent workload.
***
## Conversations with Bad Feedback
Review conversations where users gave negative ratings (thumbs down).
### What's Shown
| Column | Description |
| ---------------------- | --------------------------- |
| **Visitor Email** | Email address (if provided) |
| **Country** | Visitor location with flag |
| **Bad Feedback Count** | Number of negative ratings |
| **Last Feedback** | When the rating was given |
### Click to View
Click any conversation to see the full chat history and understand what went wrong.
### Common Issues to Look For
1. **Incorrect information**: AI gave wrong answers - update your knowledge base
2. **Missing information**: AI couldn't answer - add content for these topics
3. **Tone issues**: Response style didn't match expectations - adjust your AI persona
4. **Loop responses**: AI repeated itself - simplify your content structure
***
## Leads Captured
View and manage all captured leads from conversations.
| Column | Description |
| --------------- | --------------------------------------------------------- |
| **Email** | Visitor's email address |
| **Source** | Where the lead came from (newsletter, contact form, etc.) |
| **Country** | Visitor location (flag) |
| **Captured At** | When the conversation started (local time) |
### Exporting Leads
Use the **Export Report** button to download all leads as CSV for import into your CRM or email marketing tools.
***
## Most Visited Links
Track which links users click most frequently within the chat.
| Column | Description |
| ---------------- | --------------------------- |
| **URL** | The link destination |
| **Link Text** | What the link said |
| **Click Count** | Total clicks |
| **Latest Click** | Most recent click timestamp |
### Use This To
* **Identify popular resources**: See what information visitors find most useful
* **Optimize link placement**: Feature high-performing links more prominently
* **Improve descriptions**: Better link text leads to more clicks
* **Track conversions**: See if visitors are clicking to key pages (pricing, signup, etc.)
***
## Pro+ Best Practices
Every week, spend 15 minutes reviewing:
1. Top Unanswered Questions - add content for the top 3
2. Bad Feedback Conversations - identify patterns
3. Confidence Score trends - ensure it's stable or improving
Use the Cost Savings metric to build monthly reports:
* Screenshot the dashboard with date range set to last month
* Compare to previous months to show growth
* Share with stakeholders to demonstrate value
If you see significant traffic from specific countries:
* Consider adding content in local languages
* Adjust support hours for those time zones
* Create region-specific Q\&A entries
High transfer rates indicate AI gaps:
1. Review transferred conversations
2. Identify common topics requiring human help
3. Add detailed content for those topics
4. Create Q\&A entries with specific answers
***
## Next Steps
Add answers for unanswered questions
AI-suggested content improvements
Handle escalated conversations
Review basic metrics available to all plans
### Two views
* **Visitor Geography**: Where all of your visitors come from. Counts every visitor who loaded the widget (by their first visit), so it reflects overall reach and traffic sources.
* **Conversation Geography**: Where your engaged visitors come from. Counts only visitors who started a conversation, so you can see which regions actually interact with your chatbot.
### Features
* **World map visualization**: Color-coded by volume (visitors or conversations)
* **Top 10 countries**: List with counts and flags for each view
### Use This To
* **Understand your global audience**: See if you're reaching target markets
* **Plan multilingual support**: High traffic from non-English countries may need translated content
* **Optimize support hours**: Schedule agents for time zones with most traffic
* **Tailor content**: Create region-specific answers for common questions
* **Compare reach vs. engagement**: A country with many visitors but few conversations may signal a language or relevance gap worth addressing
***
## Top Unanswered Questions
See specific questions that the AI failed to answer or answered with low confidence.
### What's Shown
| Column | Description |
| ------------- | -------------------------------------- |
| **Question** | The exact question asked by visitors |
| **Frequency** | How many times this question was asked |
| **Reason** | Low confidence or bad rating |
| **Last Seen** | When this question was last asked |
### Actions
For each unanswered question, you can take action:
| Action | Description |
| ------------ | ------------------------------------------------------ |
| **Add Q\&A** | Create a manual Q\&A entry directly from this question |
| **Dismiss** | Hide questions you've already addressed |
The Q\&A dialog opens with the question pre-filled
Provide a clear, helpful response
The question is removed from your list and added to your knowledge base
Review this report weekly. Each question you address improves your AI Resolution Rate and reduces agent workload.
***
## Conversations with Bad Feedback
Review conversations where users gave negative ratings (thumbs down).
### What's Shown
| Column | Description |
| ---------------------- | --------------------------- |
| **Visitor Email** | Email address (if provided) |
| **Country** | Visitor location with flag |
| **Bad Feedback Count** | Number of negative ratings |
| **Last Feedback** | When the rating was given |
### Click to View
Click any conversation to see the full chat history and understand what went wrong.
### Common Issues to Look For
1. **Incorrect information**: AI gave wrong answers - update your knowledge base
2. **Missing information**: AI couldn't answer - add content for these topics
3. **Tone issues**: Response style didn't match expectations - adjust your AI persona
4. **Loop responses**: AI repeated itself - simplify your content structure
***
## Leads Captured
View and manage all captured leads from conversations.
| Column | Description |
| --------------- | --------------------------------------------------------- |
| **Email** | Visitor's email address |
| **Source** | Where the lead came from (newsletter, contact form, etc.) |
| **Country** | Visitor location (flag) |
| **Captured At** | When the conversation started (local time) |
### Exporting Leads
Use the **Export Report** button to download all leads as CSV for import into your CRM or email marketing tools.
***
## Most Visited Links
Track which links users click most frequently within the chat.
| Column | Description |
| ---------------- | --------------------------- |
| **URL** | The link destination |
| **Link Text** | What the link said |
| **Click Count** | Total clicks |
| **Latest Click** | Most recent click timestamp |
### Use This To
* **Identify popular resources**: See what information visitors find most useful
* **Optimize link placement**: Feature high-performing links more prominently
* **Improve descriptions**: Better link text leads to more clicks
* **Track conversions**: See if visitors are clicking to key pages (pricing, signup, etc.)
***
## Pro+ Best Practices
Every week, spend 15 minutes reviewing:
1. Top Unanswered Questions - add content for the top 3
2. Bad Feedback Conversations - identify patterns
3. Confidence Score trends - ensure it's stable or improving
Use the Cost Savings metric to build monthly reports:
* Screenshot the dashboard with date range set to last month
* Compare to previous months to show growth
* Share with stakeholders to demonstrate value
If you see significant traffic from specific countries:
* Consider adding content in local languages
* Adjust support hours for those time zones
* Create region-specific Q\&A entries
High transfer rates indicate AI gaps:
1. Review transferred conversations
2. Identify common topics requiring human help
3. Add detailed content for those topics
4. Create Q\&A entries with specific answers
***
## Next Steps
Add answers for unanswered questions
AI-suggested content improvements
Handle escalated conversations
Review basic metrics available to all plans