Analytics Dashboard
The analytics dashboard displays four key metrics that give you a quick snapshot of your chatbot’s performance.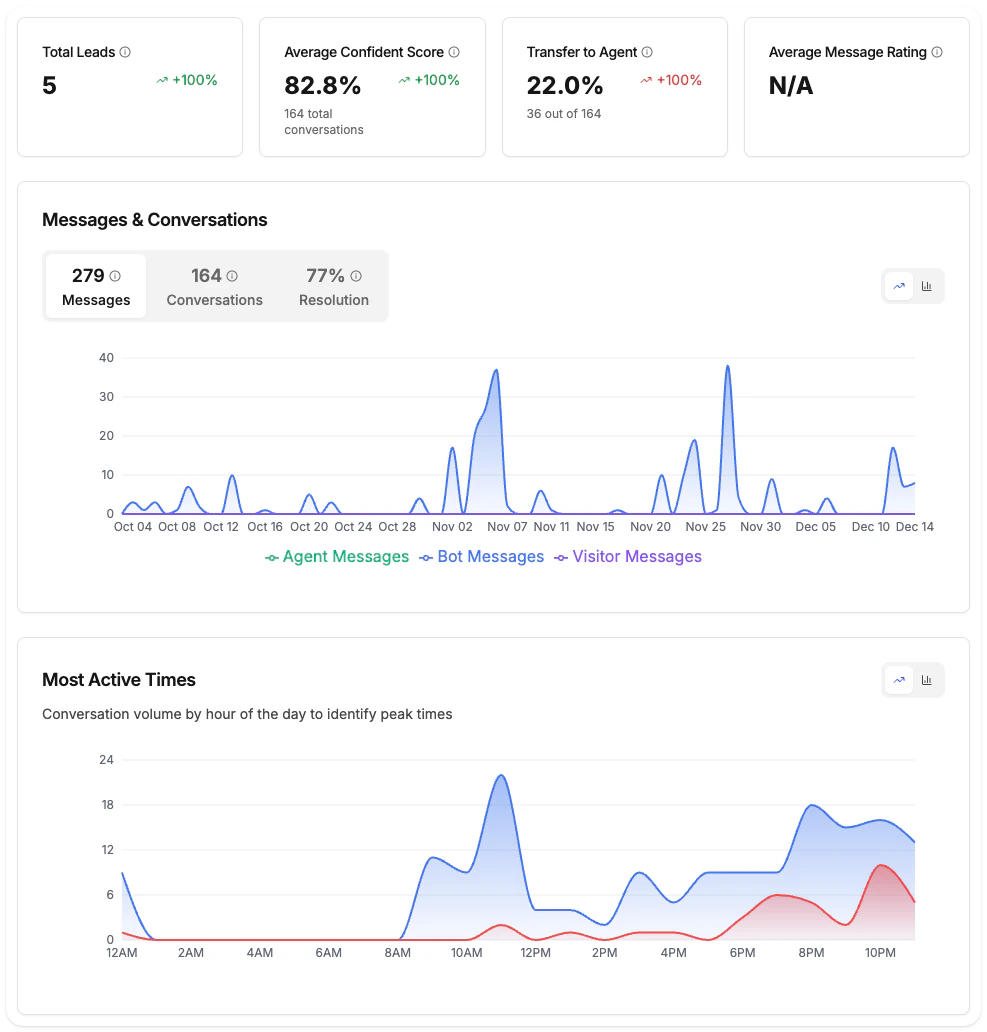
Key Metrics
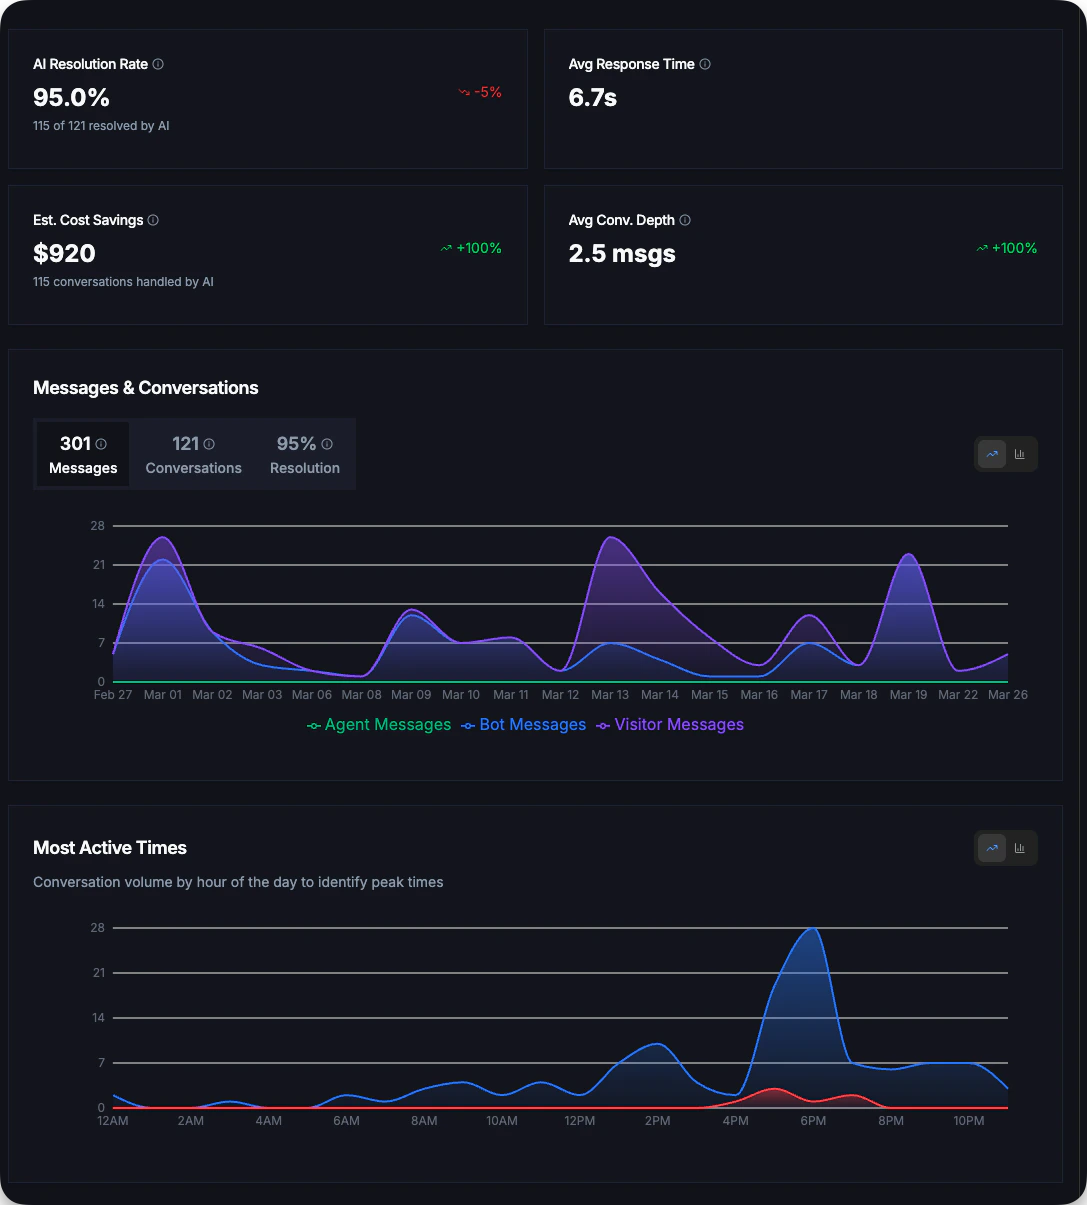
AI Resolution Rate
Percentage of conversations fully resolved by AI without human agent involvement. Higher is better.This is the inverse of “Transfer to Agent” - it shows how effectively your AI handles customer queries independently.
Avg Response Time
Average time for the AI to generate and send a response. Lower is better for user experience.Displayed in seconds (e.g., “6.3s”) or milliseconds for faster responses.
Total Leads
Number of unique visitors who provided their email address during conversations.Track how effectively your chatbot captures contact information for follow-up.
Message Rating
Average rating of bot messages based on visitor feedback. 100% means all rated messages were positive (thumbs up).Shows the ratio of positive to total rated messages.
Understanding the Numbers
| Metric | Good | Needs Attention |
|---|---|---|
| AI Resolution Rate | > 80% | < 60% |
| Avg Response Time | < 5s | > 10s |
| Message Rating | > 80% | < 60% |
Messages & Conversations Trend
Track conversation and message volume over time with the trend chart.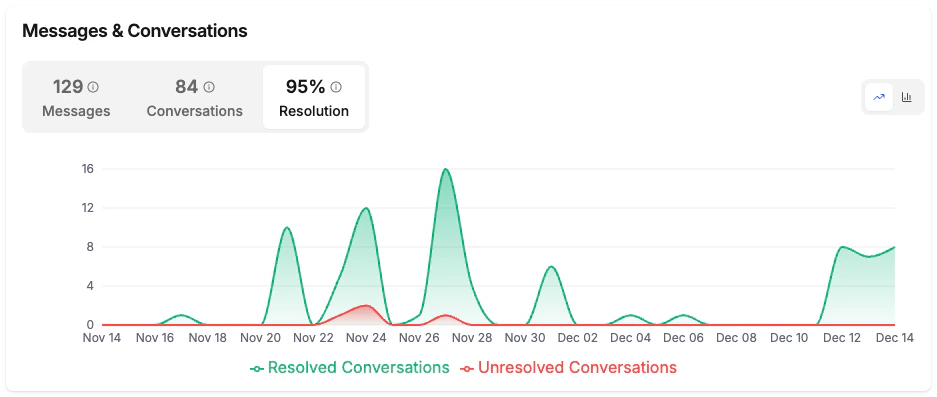
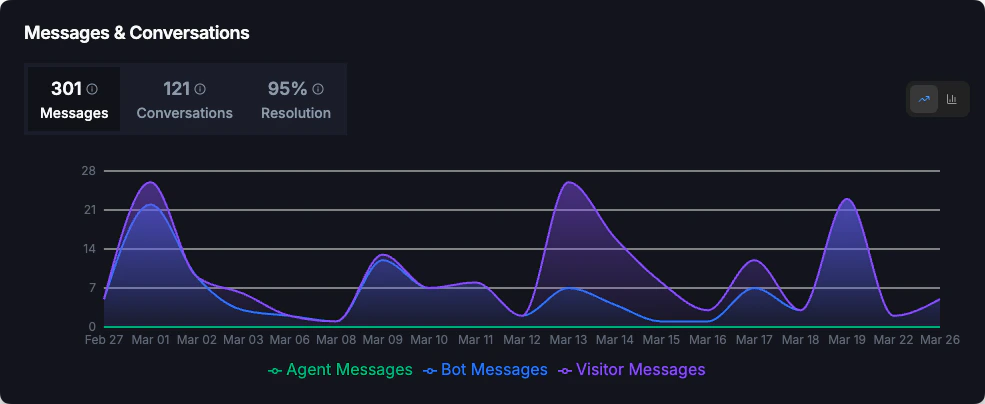
Three Views
The chart offers three tabs to analyze different aspects:- Messages
- Conversations
- Resolution
View message volume breakdown:
- Bot messages: Responses from your AI chatbot
- Agent messages: Responses from human agents (if live support is enabled)
- Visitor messages: Questions and messages from website visitors
What to Look For
This chart helps you identify:- Busiest days and weeks: Plan support coverage accordingly
- Seasonal patterns: Prepare for recurring high-traffic periods
- Campaign impact: See spikes after marketing campaigns
- Resolution trends: Monitor if resolution rate is improving over time
Export Reports
All users can export their report data as CSV files.What’s Included in Export
- Conversation details and metadata
- Message content and timestamps
- Lead information (emails captured)
- All analytics metrics
- Visitor country data
Improving Your Metrics
Increase AI Resolution Rate
Increase AI Resolution Rate
- Add more content to your knowledge base
- Create Q&A entries for frequently asked questions
- Review and address unanswered questions (Pro+ feature)
- Keep your website content up to date with regular crawls
Improve Response Time
Improve Response Time
Response time is primarily determined by AI processing. If times are consistently high:
- Simplify complex knowledge base entries
- Break long answers into shorter, focused responses
- Contact support if response times exceed 15 seconds consistently
Capture More Leads
Capture More Leads
- Enable the email capture feature in widget settings
- Ask for email at appropriate points in the conversation
- Offer value (like sending a summary) in exchange for email
Boost Message Rating
Boost Message Rating
- Review conversations with negative feedback
- Update knowledge base with more accurate answers
- Ensure your AI’s tone matches your brand voice
- Add more detailed answers for complex topics
Answerable Questions
See what questions your AI chatbot can answer from its knowledge base. This feature helps you understand the scope of your chatbot’s capabilities.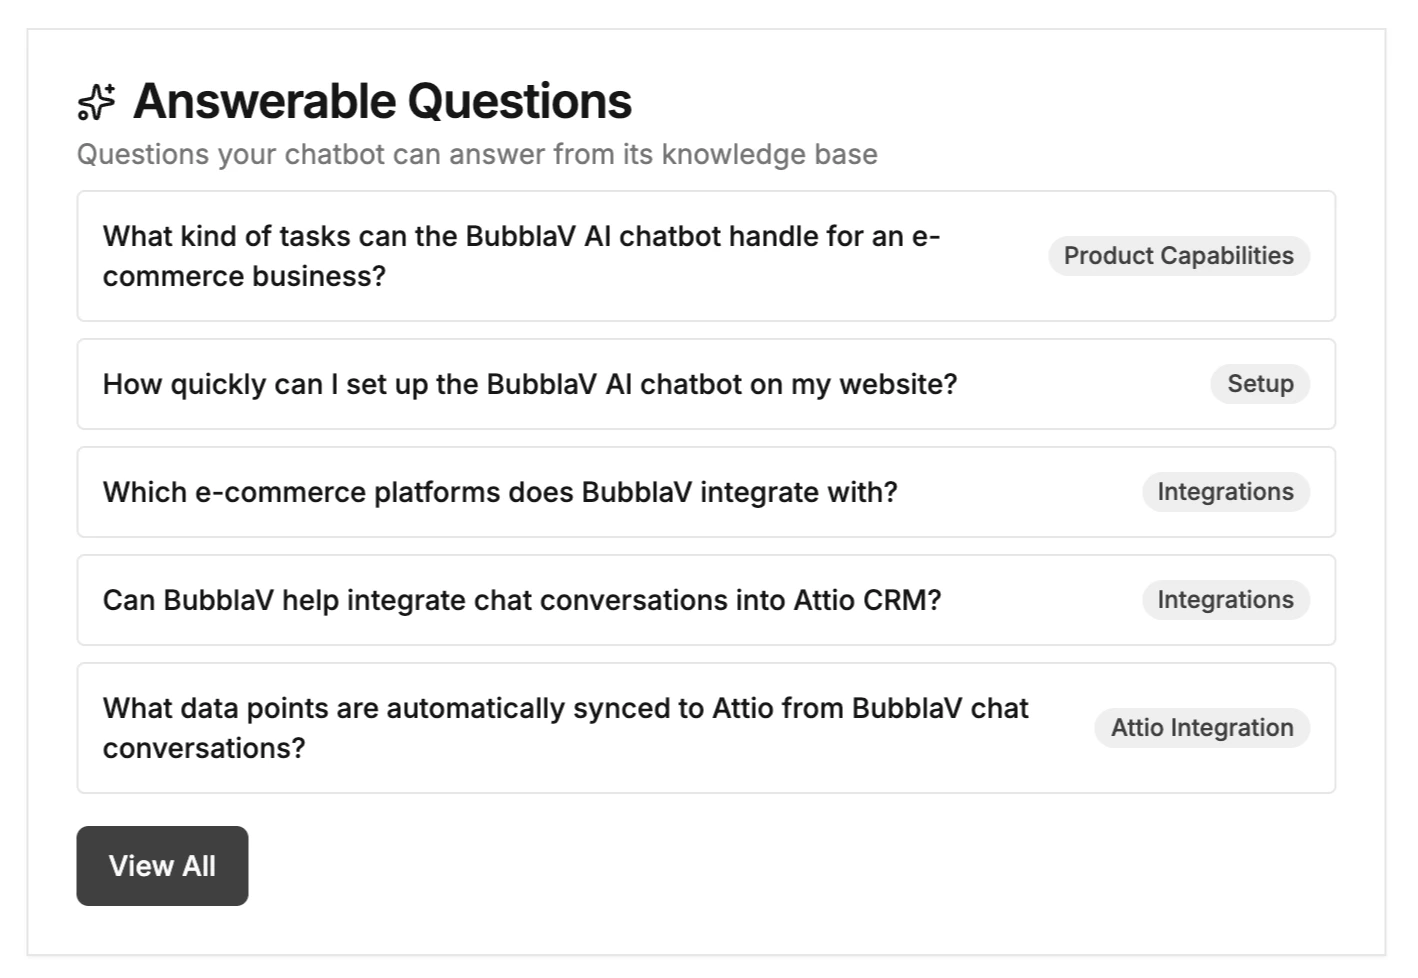
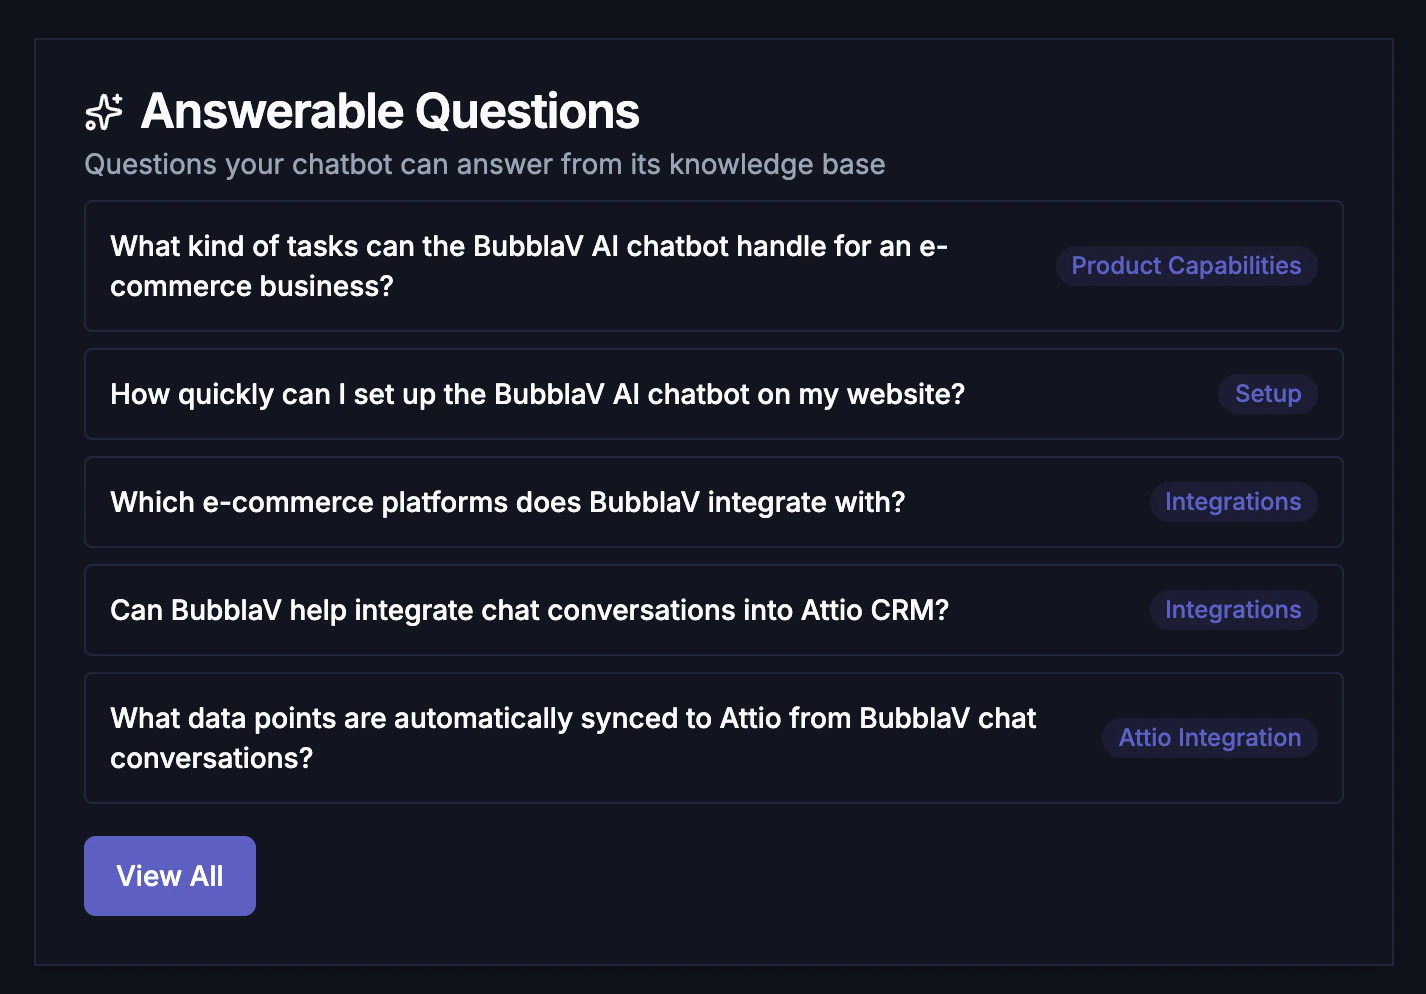
What’s Shown
| Column | Description |
|---|---|
| Question | A question visitors could ask that your chatbot can answer |
| Category | Topic category (e.g., Pricing, Support, Product) |
How Questions Are Generated
The AI analyzes your knowledge base (website content, files, Q&A entries) and generates realistic questions that visitors might ask. Questions are automatically regenerated when you add or update knowledge.Use This To
- Validate your knowledge base: Confirm your chatbot can answer common questions
- Identify content gaps: See what topics are covered well vs. missing
- Train your team: Share this list with support staff to understand AI capabilities
- Content planning: Add knowledge for important questions that aren’t covered
Most Asked Questions
Track what your visitors are actually asking to identify trends and content gaps.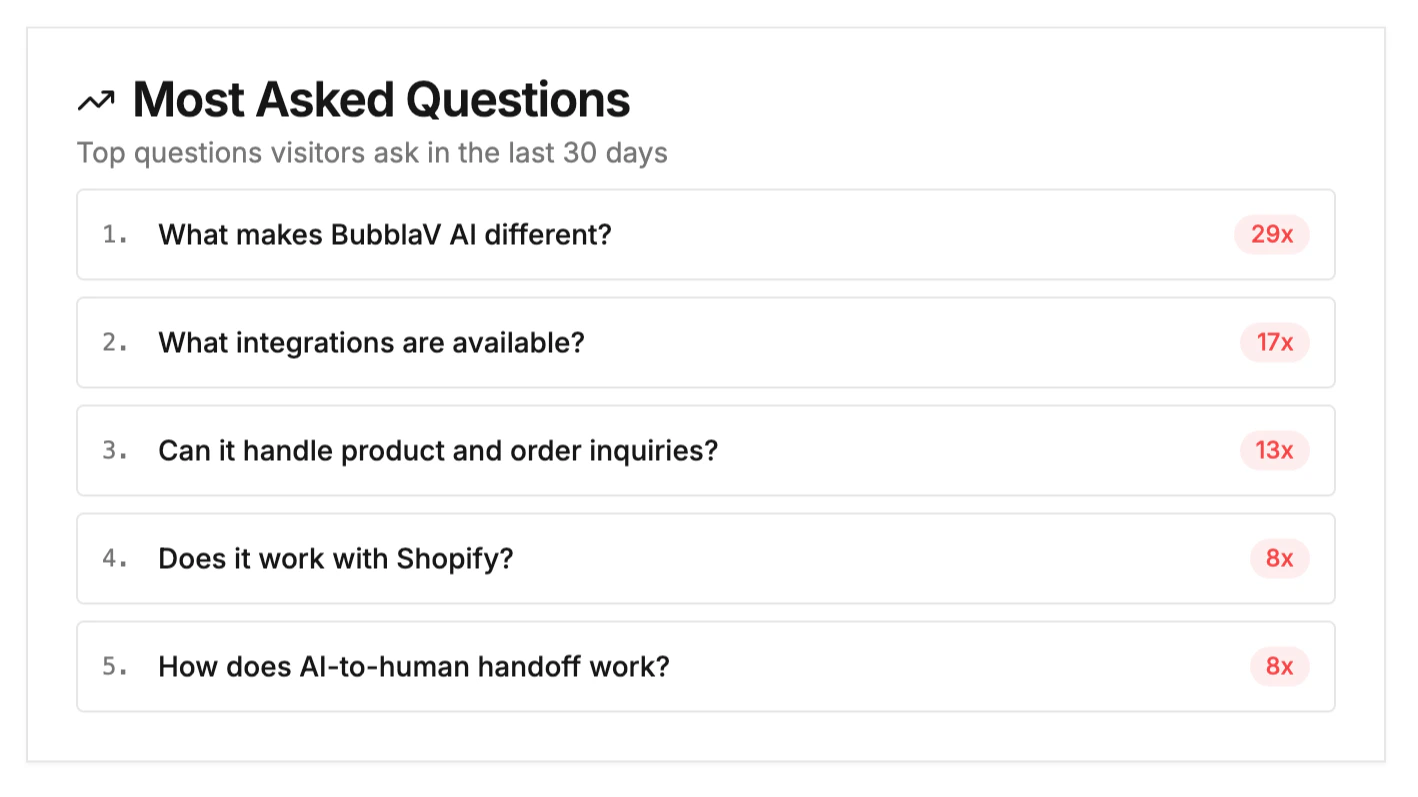
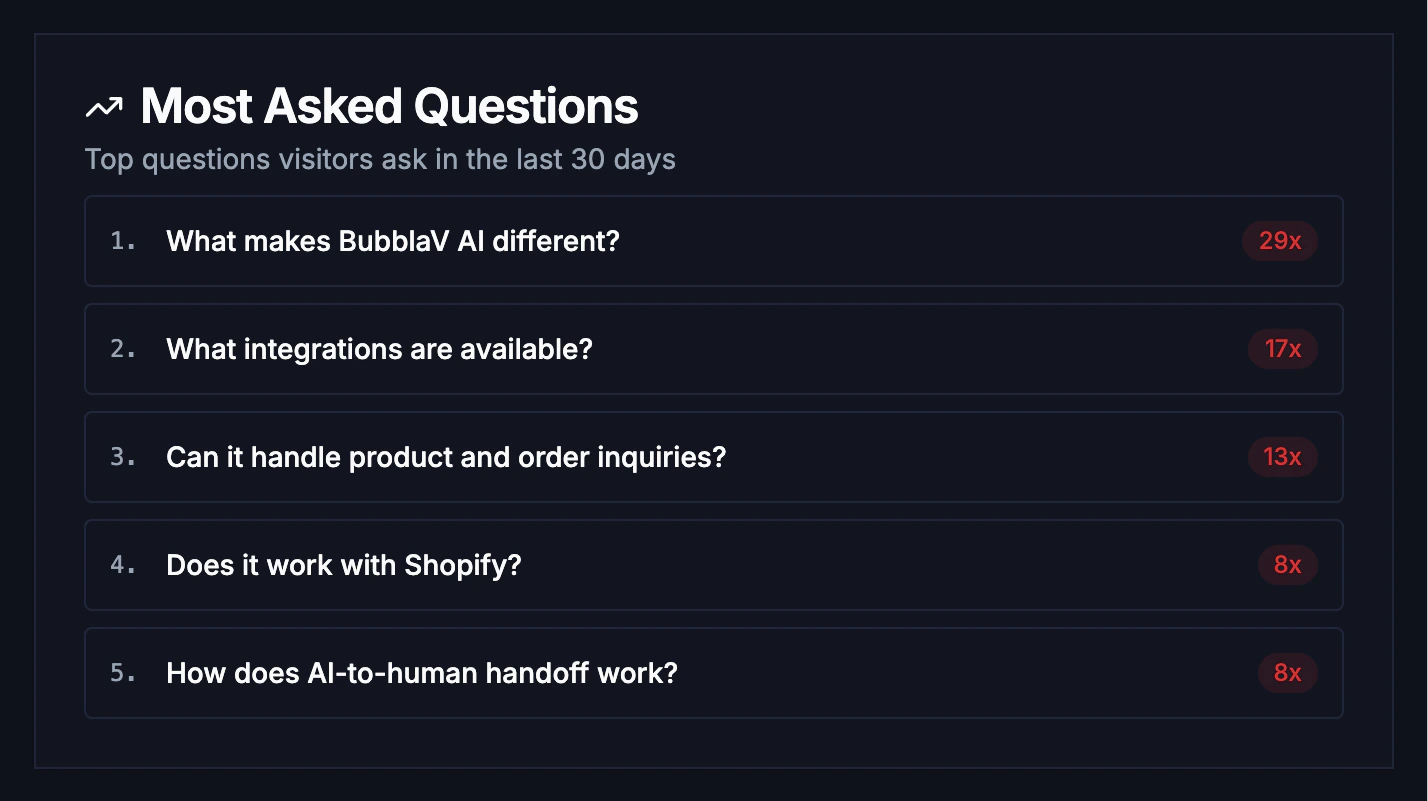
What’s Shown
| Column | Description |
|---|---|
| Rank | Question popularity ranking |
| Question | The exact question asked by visitors |
| Frequency | How many times this question was asked |
How It Works
Questions are aggregated from all conversations in the selected date range. Similar questions are grouped together, and common greetings (hi, hello, thanks) are filtered out.Use This To
- Prioritize content creation: Add Q&A entries for frequently asked questions
- Improve knowledge base: Update content for topics visitors ask about most
- Spot trends: See seasonal changes in customer inquiries
- Optimize AI prompts: Tune your AI’s responses for common queries
Upgrade to Pro+
Want deeper insights? Pro+ plans unlock advanced analytics:Cost Savings Calculator
See estimated savings from AI handling conversations
Confidence Scores
Monitor AI certainty levels across conversations
Geographic Insights
Understand where your visitors come from
AI Performance Analysis
Identify and fix knowledge gaps
View Pro+ Reports
Explore all advanced analytics features available on Pro plans